

More tools is a good thing. The bill comes due in context. Tool definitions take up space, tool results take up space, and a model choosing among a pile of look-alike tools is more likely to choose wrong.
First, figure out where the context is going
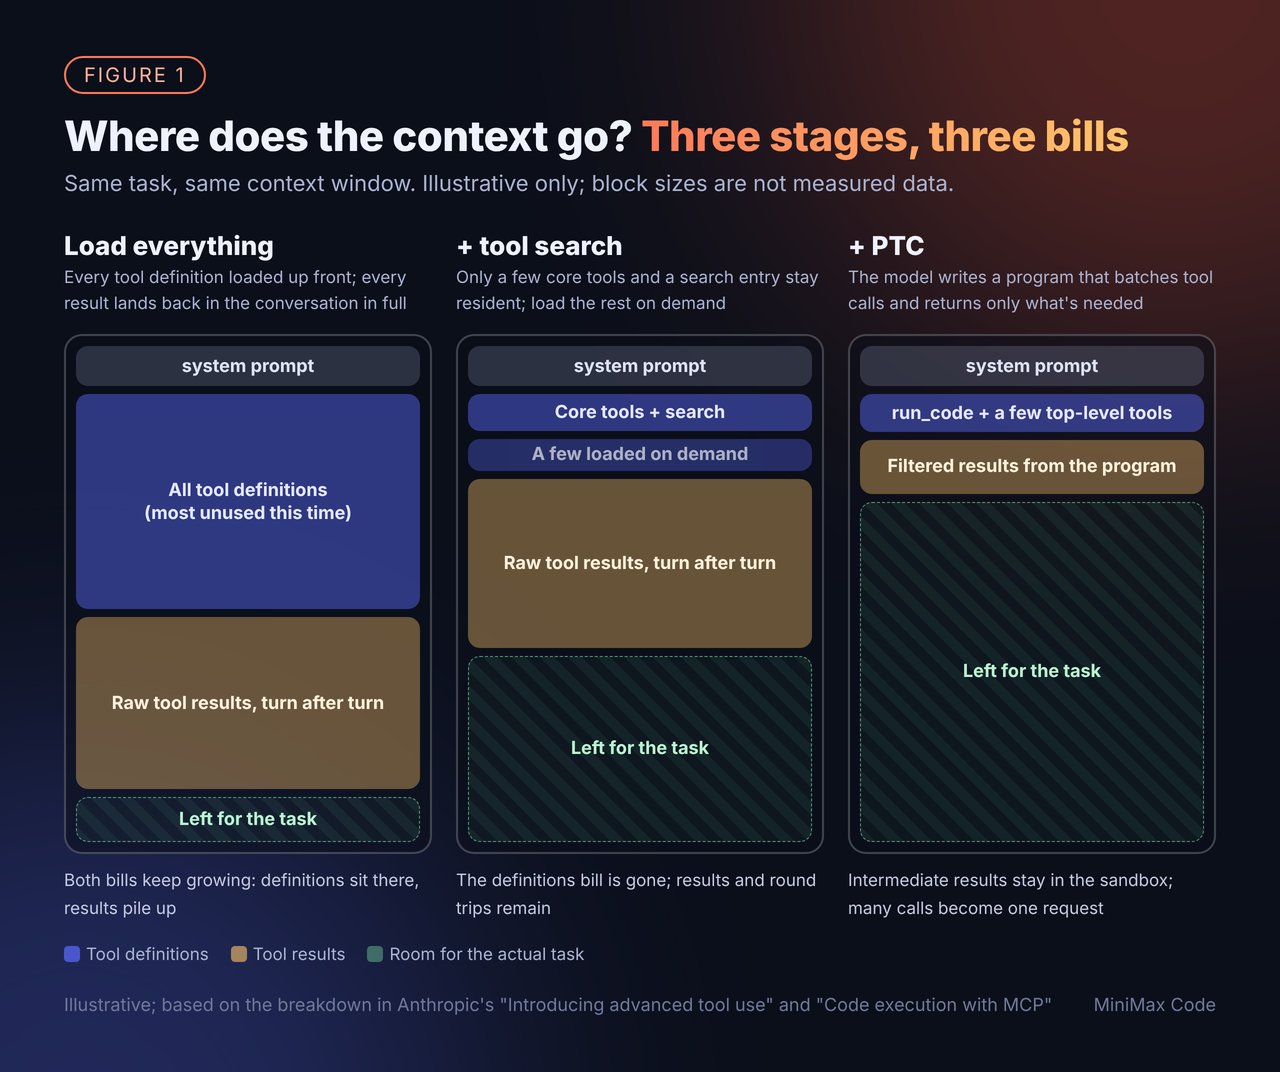
notification-send-user vs. notification-send-channel — and the model picks the wrong one or passes the wrong arguments. One of my teammates put it bluntly: hand a model seventy-odd tools at once and its brain kind of overflows. That lines up roughly with the 30–50 rule of thumb from the last post.
Once you split the bill this way, the rest is easy to follow: tool search mostly cuts cost #1, PTC mostly cuts cost #2.
Step 0: Cut first
Before any clever mechanism, the cheapest fix is always to load less. Nothing fancy here, but it solves a surprising amount of the problem.- Merge tools around user intent. Don’t map low-level APIs 1:1 to tools. “List issues,” “filter issues by label,” and “filter issues by author” can be one tool with parameters.
- Make names and descriptions distinguishable. The model picks tools by name and description. If two descriptions read alike, the model can’t tell them apart either. While you’re at it, document the return format — you’ll need it later when the model writes code against these tools.
- Group them. OpenAI’s tool search docs recommend grouping tools into namespaces by domain, ideally fewer than 10 functions each. Clear groups make things faster to find, for people and models alike.
- Decide what stays resident. Tools you use nearly every turn — read file, edit file, run command — should always be loaded. More on this later.
Step 1: Deferred loading + tool search
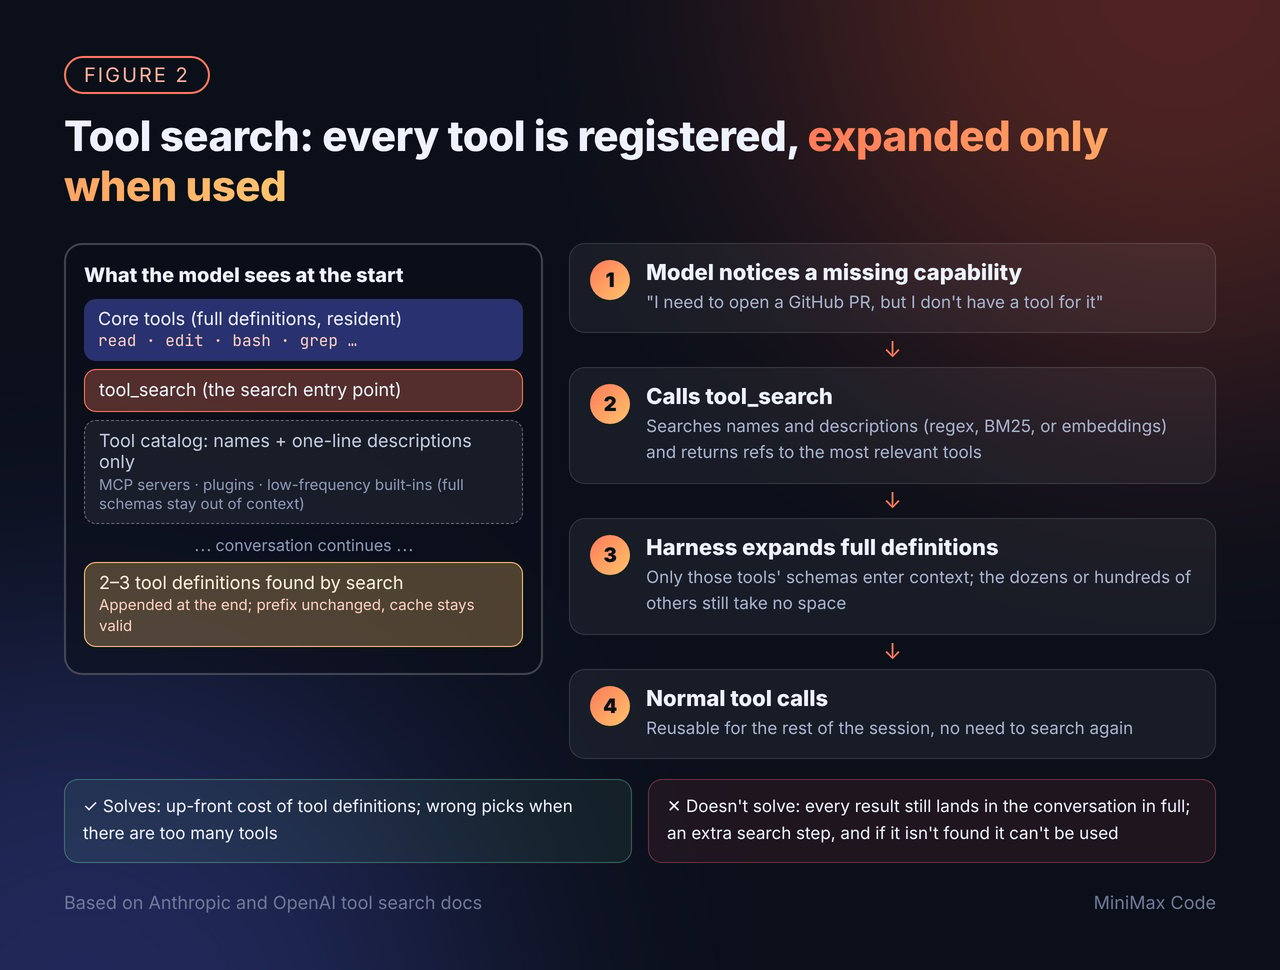
defer_loading: true and pairs them with a Tool Search Tool, using regex, BM25, or your own search. OpenAI’s tool search is similar, and it appends loaded definitions to the end of context so the prefix stays the same and the prompt cache isn’t invalidated. Claude Code now enables tool search by default: core tools like Bash, Read, and Edit load up front, everything else is discovered on demand. You can also set it to auto, which only kicks in once deferrable tool definitions exceed 10% of context (docs).
The impact is real. Per Anthropic, up-front tool definition overhead drops by about 85%, and on their MCP evals Claude Opus 4 went from 49% to 74% accuracy, and Opus 4.5 from 79.5% to 88.1% (source). Beyond saving tokens, tool selection gets more accurate, because the model has fewer candidates in front of it.
How we use it in MCode
Tool search is on by default in MCode. Here’s how we split things:- Core built-in tools stay resident. Read, write, edit, search, run command — the high-frequency tools always carry their full definitions. Making the model search first just to save a few hundred tokens isn’t worth it.
- Low-frequency built-in tools become searchable. Things you rarely need go into the catalog and load on use.
- MCP tools switch automatically based on size. If there are only a few tools with small definitions, they load normally. Once the count or size crosses a threshold, they move into tool search automatically. Users don’t have to configure anything.
Where we got burned
- If it can’t be found, it doesn’t exist. Tool search turns “can the model use this tool?” into “can the model find this tool?” Vague description, mismatched keywords, and that tool might as well not be there. Sometimes the model keeps rephrasing its search and goes around in circles. So “make descriptions distinguishable” matters even more at this stage.
- Don’t assume default retrieval works everywhere. Someone benchmarked a tool search setup that tied the best configuration on a clean benchmark, then fell 19 points behind on 525 real MCP tools (@kachar136). Retrieval quality varies a lot by tool set. Test on yours.
- Not everything belongs in there. If a category of tools needs to fetch its catalog over the network every turn, putting it behind tool search can actually slow down time to first token. We hit exactly this and moved those tools back into the resident set.
- “In the request” doesn’t mean “the model has seen it.” Deferred tools show up in the request’s tool list, but at any given moment the model may not have seen their full definitions yet. When debugging or running evals, look at what the model could actually see at that point, not just what the request listed.
Step 2: PTC — let the model write code that calls tools
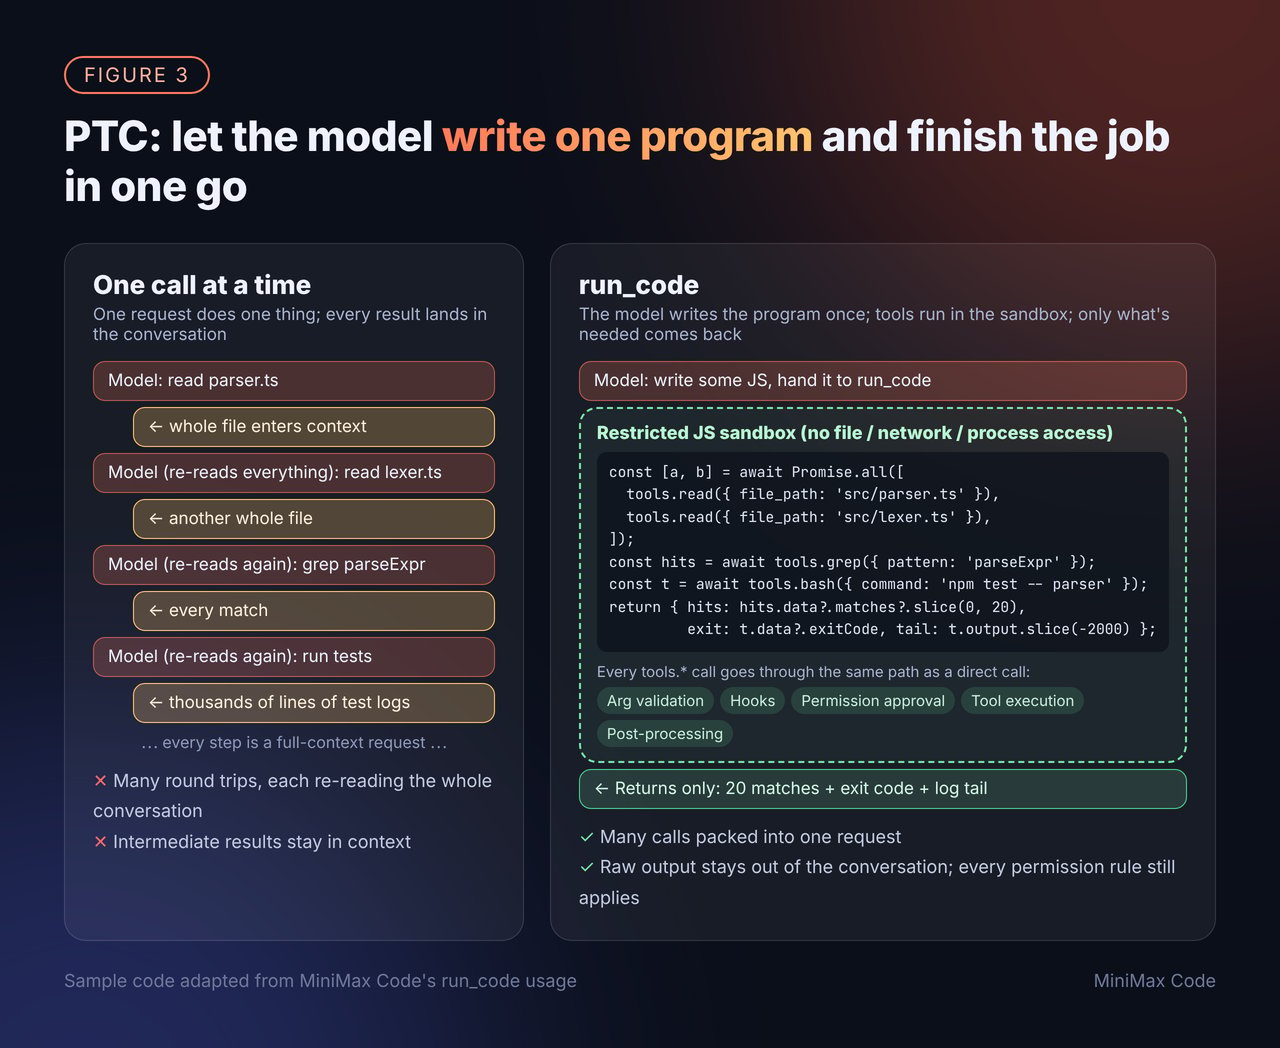
- Anthropic’s Programmatic Tool Calling: tools are called from inside a code execution environment. On complex research tasks, average tokens dropped from 43,588 to 27,297 — a 37% reduction — with slightly better accuracy on several evals (source). In another post, they organize MCP tools as code files the model reads on demand; one example went from 150K tokens to 2,000 (source).
- Cloudflare’s Code Mode: just two tools,
search()andexecute(), cover 2,500+ endpoints in about 1,000 tokens (source). - OpenAI’s Programmatic Tool Calling: the model writes JavaScript that calls tools marked as programmatically callable, inside a hosted runtime.
- Pi’s Codemode: code runs on the harness side, and each tool can be configured individually as deferred or code-only (source).
How we do it in MCode
PTC in MCode is still experimental and we’re still polishing it. The model gets arun_code tool; it writes a chunk of JavaScript, and inside that program it calls the agent’s existing tools through tools.*. A few key design decisions:
- JavaScript. In our experience models write JS more reliably, and a small JS engine compiles to WASM, so we don’t have to ship a separate interpreter.
- The program itself can’t touch anything. Code runs in a lightweight JS engine inside an isolated worker, with no file, network, or process access. The only thing it can do is call tools the agent already has. To be clear, this isn’t a security-audited, hardened sandbox. The boundary it enforces is: code can’t go around the tools to do things on its own.
- No permission bypass. Every
tools.*call inside a program goes through the exact same path as a direct call: argument validation, hooks, permission approval, UI display — nothing skipped. If an action needs user confirmation when called directly, it still needs confirmation inside a program. - Failures return results, not exceptions. Models rarely write try/catch. If one failed tool crashes the whole program, all the earlier work is wasted. So a failed tool returns a result containing the error, and the program decides what to do.
Where we got burned
- Offering it isn’t enough — you have to actually move the tools in. At first we put
run_codeat the top level alongside every native tool. The model barely used it, and overhead went up. Only after we moved most tools to code-only did the model start actually writing programs. - Not every tool should move. We keep only a few kinds at the top level: tools that interact with the user, tools that change session state, tools whose result you need to read before deciding the next step (like loading a skill or tool search), browser and publishing tools, and subagent dispatch. We tried moving subagent dispatch into programs, and it got used noticeably less.
- What if the model calls a tool that’s been moved? Give it a hint saying the tool has to be called inside
run_code. We found a firm, direct hint works much better than a polite suggestion. - For long commands, just wait inside the program. Pushing a long command to the background and polling looks “smarter,” but every poll is another full-context request, which ends up costing more. Blocking on the result inside the program is cheaper.
- Features keyed on tool names break silently. Once a tool moves into programs, any logic triggered by that tool’s name — certain reminders, stats — stops seeing it get called, and nothing errors out. Audit those dependencies before you move anything.
- Something in the middle can drop argument types. We hit a case where some hop in the request pipeline coerced types for tools that weren’t declared at the top level, and argument types got lost. The fix was to restore the types from each tool’s own schema.
- Programs have bugs too. The most common failures are quoting and escaping, especially when building shell commands inside JS strings.
Which step when — and can you combine them?
Anthropic’s advice is also to layer by bottleneck: definitions too big → tool search; intermediate results too large → PTC; arguments keep coming out wrong → add usage examples to your tools. Conversely, for one-off simple operations, or when the model genuinely needs to see an intermediate result to decide what’s next, don’t force it into a program.
You can absolutely use both together, and we think you should. Tool search organizes the catalog; PTC packs calls into programs on top of that. One detail to watch: OpenAI’s docs say explicitly that tool search runs at the top level and can’t be called from inside a program, so search for and load the tools you need first, then write the program. That’s also why tool search stays at the top level in MCode.
A self-check list
- Do the math first: how much context do tool definitions take, how much do tool results take per task, and how many round trips does a task average?
- Tools are merged around user intent, names and descriptions are clearly distinguishable, and return formats are documented.
- High-frequency core tools stay resident; low-frequency tools and large batches of MCP tools are deferred.
- You’ve tested tool search recall on your own tool set, not just someone else’s benchmark.
- Tools that fetch their catalog over the network every turn don’t slow down time to first token.
- When adopting PTC, you actually move tools into programs, and you’ve thought through which must stay at the top level.
- Tool calls inside programs go through the same permissions, hooks, and display as direct calls.
- Failed tools return an error result instead of throwing; tools return structured data where possible.
- You’ve audited all logic keyed on tool names so nothing silently breaks after the move.
- Run end-to-end evals before and after — look at scores, but also request counts and tokens.
Closing thoughts
Looking back, these three steps are the same idea as the last post: get the right information into context at the right time. Trimming means putting in less; tool search means putting it in later; PTC means keeping what the model doesn’t need to see outside entirely. One more takeaway: each step lays the groundwork for the next. If your tool catalog is a mess, tool search won’t find things; if tool search isn’t solid, PTC will struggle too. Don’t try to do it all at once. Go bottleneck by bottleneck, and measure at every step. Give MiniMax Code a try, and come talk to us on GitHub about how you manage tools and context. We’d love to hear how other teams are handling it.References
- Anthropic, Introducing advanced tool use on the Claude Developer Platform
- Anthropic, Code execution with MCP: Building more efficient agents
- Anthropic, Building agents: When to fold subagents into your main agent loop
- Claude Code docs, Tool search
- Cloudflare, Code Mode: the better way to use MCP
- Cloudflare, Code Mode: give agents an entire API in 1,000 tokens
- OpenAI docs, Tool search
- OpenAI docs, Programmatic tool calling
- Earendil (Pi), You Said No MCP! (X post)
- @kachar136, Tool search compared on a real MCP tool set
- @jasonfesta, PTC only saves context when the program filters results first